
Page 177 - Clinical Small Animal Internal Medicine
P. 177
16 Imaging in Cardiovascular Disease 145
Table 16.4 Standard echocardiographic and pulsed‐wave Table 16.5 Standard echocardiographic and pulsed‐wave
VetBooks.ir of various breeds
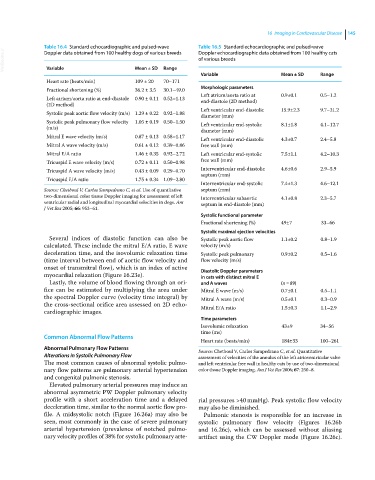
Doppler echocardiographic data obtained from 100 healthy cats
Doppler data obtained from 100 healthy dogs of various breeds
Mean ± SD
Variable
Range
Variable Mean ± SD Range
Heart rate (beats/min) 109 ± 20 70–171
Fractional shortening (%) 36.2 ± 3.5 30.1–49.0 Morphologic parameters
Left atrium/aorta ratio at 0.9±0.1 0.5–1.2
Left atrium/aorta ratio at end‐diastole 0.90 ± 0.11 0.52–1.13 end‐diastole (2D method)
(2D method)
Left ventricular end-diastolic 15.9±2.3 9.7–21.2
Systolic peak aortic flow velocity (m/s) 1.29 ± 0.22 0.92–1.88
diameter (mm)
Systolic peak pulmonary flow velocity 1.05 ± 0.19 0.50–1.50 Left ventricular end-systolic 8.1±1.8 4.1–12.7
(m/s)
diameter (mm)
Mitral E wave velocity (m/s) 0.87 ± 0.13 0.58–1.17
Left ventricular end-diastolic 4.3±0.7 2.4–5.8
Mitral A wave velocity (m/s) 0.61 ± 0.12 0.39–0.86 free wall (mm)
Mitral E/A ratio 1.46 ± 0.35 0.92–2.72 Left ventricular end-systolic 7.5±1.1 4.2–10.3
Tricuspid E wave velocity (m/s) 0.72 ± 0.11 0.50–0.98 free wall (mm)
Tricuspid A wave velocity (m/s) 0.43 ± 0.09 0.29–0.70 Interventricular end-diastolic 4.6±0.6 2.9–5.9
septum (mm)
Tricuspid E/A ratio 1.75 ± 0.34 1.09–2.80
Interventricular end-systolic 7.4±1.3 4.6–12.1
Source: Chetboul V, Carlos Sampedrano C, et al. Use of quantitative septum (mm)
two‐dimensional color tissue Doppler imaging for assessment of left Interventricular subaortic 4.1±0.8 2.3–5.7
ventricular radial and longitudinal myocardial velocities in dogs. Am septum in end-diastole (mm)
J Vet Res 2005; 66: 953–61.
Systolic functional parameter
Fractional shortening (%) 49±7 33–66
Systolic maximal ejection velocities
Several indices of diastolic function can also be Systolic peak aortic flow 1.1±0.2 0.8–1.9
calculated. These include the mitral E/A ratio, E wave velocity (m/s)
deceleration time, and the isovolumic relaxation time Systolic peak pulmonary 0.9±0.2 0.5–1.6
(time interval between end of aortic flow velocity and flow velocity (m/s)
onset of transmitral flow), which is an index of active Diastolic Doppler parameters
myocardial relaxation (Figure 16.23e). in cats with distinct mitral E
Lastly, the volume of blood flowing through an ori- and A waves (n = 89)
fice can be estimated by multiplying the area under Mitral E wave (m/s) 0.7±0.1 0.5–1.1
the spectral Doppler curve (velocity time integral) by Mitral A wave (m/s) 0.5±0.1 0.3–0.9
the cross‐sectional orifice area assessed on 2D echo- Mitral E/A ratio 1.5±0.3 1.1–2.9
cardiographic images.
Time parameters
Isovolumic relaxation 43±9 34–56
time (ms)
Common Abnormal Flow Patterns
Heart rate (beats/min) 184±33 100–261
Abnormal Pulmonary Flow Patterns Source: Chetboul V, Carlos Sampedrano C, et al. Quantitative
Alterations in Systolic Pulmonary Flow assessment of velocities of the annulus of the left atrioventricular valve
The most common causes of abnormal systolic pulmo- and left ventricular free wall in healthy cats by use of two-dimensional
nary flow patterns are pulmonary arterial hypertension color tissue Doppler imaging. Am J Vet Res 2006; 67: 250–8.
and congenital pulmonic stenosis.
Elevated pulmonary arterial pressures may induce an
abnormal asymmetric PW Doppler pulmonary velocity
profile with a short acceleration time and a delayed rial pressures >40 mmHg). Peak systolic flow velocity
deceleration time, similar to the normal aortic flow pro- may also be diminished.
file. A midsystolic notch (Figure 16.26a) may also be Pulmonic stenosis is responsible for an increase in
seen, most commonly in the case of severe pulmonary systolic pulmonary flow velocity (Figures 16.26b
arterial hypertension (prevalence of notched pulmo- and 16.26c), which can be assessed without aliasing
nary velocity profiles of 38% for systolic pulmonary arte- artifact using the CW Doppler mode (Figure 16.26c).