
Page 37 - Banking Finance April 2020
P. 37
ARTICLE
fastest growing nations in the world. The mixing of Growing influence of industrialists in Government is meant
Capitalism with politics led to the development of Crony to ease the mobility of public funds from banks. The public
capitalism. The paradigm shift to capitalism made the sector banks which are under the control of Government of
industrialists the centerpiece in the decision making process India are channeling the public money collected in the form
of the country. of deposits from general public to the industrialists of the
country.
Growing importance of the moneyed interest groups in the
country not only influenced the economy but also These public sector banks are like sitting lame ducks which
surreptitiously influenced the political culture of the country. have no other option but to fund these industrialists on the
The political parties are relentlessly trying to strike a balance directions of the politicians elected to run the Government.
between capitalism and socialism by making pro-poor
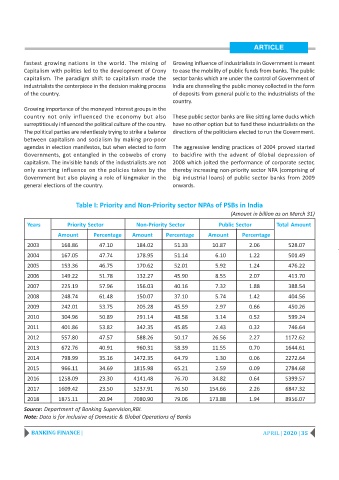
agendas in election manifestos, but when elected to form The aggressive lending practices of 2004 proved started
Governments, got entangled in the cobwebs of crony to backfire with the advent of Global depression of
capitalism. The invisible hands of the industrialists are not 2008 which jolted the performance of corporate sector,
only exerting influence on the policies taken by the thereby increasing non-priority sector NPA (comprising of
Government but also playing a role of kingmaker in the big industrial loans) of public sector banks from 2009
general elections of the country. onwards.
Table I: Priority and Non-Priority sector NPAs of PSBs in India
(Amount in billion as on March 31)
Years Priority Sector Non-Priority Sector Public Sector Total Amount
Amount Percentage Amount Percentage Amount Percentage
2003 168.86 47.10 184.02 51.33 10.87 2.06 528.07
2004 167.05 47.74 178.95 51.14 6.10 1.22 501.49
2005 153.36 46.75 170.62 52.01 5.92 1.24 476.22
2006 149.22 51.78 132.27 45.90 8.55 2.07 413.70
2007 225.19 57.96 156.03 40.16 7.32 1.88 388.54
2008 248.74 61.48 150.07 37.10 5.74 1.42 404.56
2009 242.01 53.75 205.28 45.59 2.97 0.66 450.26
2010 304.96 50.89 291.14 48.58 3.14 0.52 599.24
2011 401.86 53.82 342.35 45.85 2.43 0.32 746.64
2012 557.80 47.57 588.26 50.17 26.56 2.27 1172.62
2013 672.76 40.91 960.31 58.39 11.55 0.70 1644.61
2014 798.99 35.16 1472.35 64.79 1.30 0.06 2272.64
2015 966.11 34.69 1815.98 65.21 2.59 0.09 2784.68
2016 1258.09 23.30 4141.48 76.70 34.82 0.64 5399.57
2017 1609.42 23.50 5237.91 76.50 154.66 2.26 6847.32
2018 1875.11 20.94 7080.90 79.06 173.88 1.94 8956.07
Source: Department of Banking Supervision,RBI.
Note: Data is for inclusive of Domestic & Global Operations of Banks
BANKING FINANCE | APRIL | 2020 | 35