Page 38 - Banking Finance October 2023
P. 38

ARTICLE

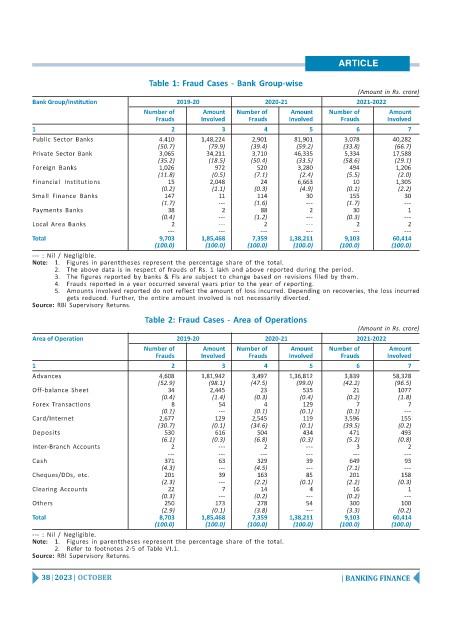
                                        Table 1: Fraud Cases - Bank Group-wise
                                                                                               (Amount in Rs. crore)
          Bank Group/Institution                2019-20                2020-21                 2021-2022
                                       Number of      Amount   Number of      Amount    Number of       Amount
                                          Frauds      Involved     Frauds    Involved      Frauds      Involved
          1                                   2            3           4           5           6            7
          Public  Sector  Banks            4.410      1,48,224     2,901       81,901       3,078       40,282
                                           (50.7)       (79.9)     (39.4)      (59.2)      (33.8)        (66.7)
          Private  Sector  Bank            3,065       34,211      3,710       46,335       5,334       17,588
                                           (35.2)       (18.5)     (50.4)      (33.5)      (58.6)        (29.1)
          Foreign  Banks                   1,026          972        520       3,280         494         1,206
                                           (11.8)        (0.5)      (7.1)       (2.4)       (5.5)         (2.0)
          Financial  Institutions            15         2,048         24       6,663          10         1,305
                                            (0.2)        (1.1)      (0.3)       (4.9)       (0.1)         (2.2)
          Small  Finance  Banks             147            11        114          30         155            30
                                            (1.7)          ---      (1.6)         ---       (1.7)           ---
          Payments  Banks                    38            2          88           2          30            1
                                            (0.4)          ---      (1.2)         ---       (0.3)           ---
          Local  Area  Banks                  2            ---         2          ---          2            2
                                             ---           ---        ---         ---         ---           ---
          Total                            9,703      1,85,468     7,359     1,38,211       9,103       60,414
                                          (100.0)      (100.0)    (100.0)     (100.0)      (100.0)      (100.0)
          ---  :  Nil  /  Negligible.
          Note:  1.  Figures  in  parenttheses  represent  the  percentage  share  of  the  total.
               2.  The  above  data  is  in  respect  of  frauds  of  Rs.  1  lakh  and  above  reported  during  the  period.
               3.  The  figures  reported  by  banks  &  Fls  are  subject  to  change  based  on  revisions  filed  by  them.
               4.  Frauds  reported  in  a  year  occurred  several  years  prior  to  the  year  of  reporting.
               5.  Amounts  involved  reported  do  not  reflect  the  amount  of  loss  incurred.  Depending  on  recoveries,  the  loss  incurred
                   gets  reduced.  Further,  the  entire  amount  involved  is  not  necessarily  diverted.
          Source:  RBI  Supervisory  Returns.
                                       Table 2: Fraud Cases - Area of Operations
                                                                                               (Amount in Rs. crore)
          Area of Operation                     2019-20                2020-21                 2021-2022
                                       Number of      Amount   Number of      Amount    Number of       Amount
                                          Frauds      Involved     Frauds    Involved      Frauds      Involved
          1                                   2            3           4           5           6            7
          Advances                         4,608      1,81,942     3,497     1,36,812       3,839       58,328
                                           (52.9)       (98.1)     (47.5)      (99.0)      (42.2)        (96.5)
          Off-balance  Sheet                 34         2,445         23         535          21          1077
                                            (0.4)        (1.4)      (0.3)       (0.4)       (0.2)         (1.8)
          Forex  Transactions                 8            54          4         129           7            7
                                            (0.1)          ---      (0.1)       (0.1)       (0.1)           ---
          Card/Internet                    2,677          129      2,545         119        3,596          155
                                           (30.7)        (0.1)     (34.6)       (0.1)      (39.5)         (0.2)
          Deposits                          530           616        504         434         471           493
                                            (6.1)        (0.3)      (6.8)       (0.3)       (5.2)         (0.8)
          Inter-Branch  Accounts              2            ---         2          ---          3            2
                                             ---           ---        ---         ---         ---           ---
          Cash                              371            63        329          39         649            93
                                            (4.3)          ---      (4.5)         ---       (7.1)           ---
          Cheques/DDs,  etc.                201            39        163          85         201           158
                                            (2.3)          ---      (2.2)       (0.1)       (2.2)         (0.3)
          Clearing  Accounts                 22            7          14           4          16            1
                                            (0.3)          ---      (0.2)         ---       (0.2)           ---
          Others                            250           173        278          54         300           100
                                            (2.9)        (0.1)      (3.8)         ---       (3.3)         (0.2)
          Total                            8,703      1,85,468     7,359     1,38,211       9,103       60,414
                                          (100.0)      (100.0)    (100.0)     (100.0)      (100.0)      (100.0)
          ---  :  Nil  /  Negligible.
          Note:  1.  Figures  in  parenttheses  represent  the  percentage  share  of  the  total.
               2.  Refer  to  footnotes  2-5  of  Table  VI.1.
          Source:  RBI  Supervisory  Returns.

            38 | 2023 | OCTOBER                                                            | BANKING FINANCE
   33   34   35   36   37   38   39   40   41   42   43