Page 201 - BUKU SYNOPSIS
P. 201

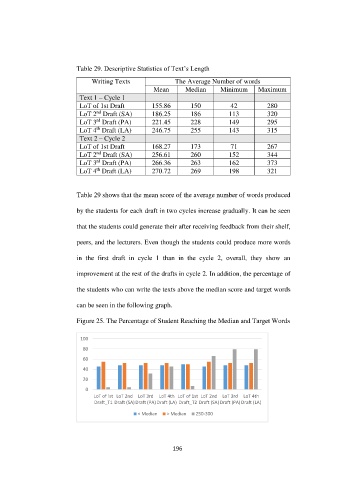
Table 29. Descriptive Statistics of Text’s Length

                                 Writing Texts                 The Average Number of words
                                                       Mean       Median      Minimum       Maximum
                             Text 1 – Cycle 1
                             LoT of 1st Draft         155.86        150           42           280
                                   nd
                             LoT 2  Draft (SA)        186.25        186          113           320
                                   rd
                             LoT 3  Draft (PA)        221.45        228          149           295
                                   th
                             LoT 4  Draft (LA)        246.75        255          143           315
                             Text 2 – Cycle 2
                             LoT of 1st Draft         168.27        173           71           267
                                   nd
                             LoT 2  Draft (SA)        256.61        260          152           344
                                   rd
                             LoT 3  Draft (PA)        266.36        263          162           373
                                   th
                             LoT 4  Draft (LA)        270.72        269          198           321


                            Table 29 shows that the mean score of the average number of words produced

                            by the students for each draft in two cycles increase gradually. It can be seen


                            that the students could generate their after receiving feedback from their shelf,

                            peers, and the lecturers. Even though the students could produce more words


                            in  the  first  draft  in  cycle  1  than  in  the  cycle  2,  overall,  they  show  an

                            improvement at the rest of the drafts in cycle 2. In addition, the percentage of


                            the students who can write the texts above the median score and target words

                            can be seen in the following graph.


                            Figure 25. The Percentage of Student Reaching the Median and Target Words


                             100
                              80
                              60
                              40

                              20
                               0
                                  LoT of !st LoT 2nd LoT 3rd  LoT 4th LoT of 1st LoT 2nd LoT 3rd  LoT 4th
                                  Draft_T1 Draft (SA)Draft (PA) Draft (LA) Draft_T2 Draft (SA)Draft (PA) Draft (LA)
                                                 < Median   > Median  250-300


                                                              196
   196   197   198   199   200   201   202   203   204   205   206