
Page 203 - BUKU SYNOPSIS
P. 203
errors, which can be seen as the minimum of errors. In order to see plainly the
number of students who made a few mistakes, the researcher provides a graph
of the percentage of students with low grammar and spelling inaccuracies in
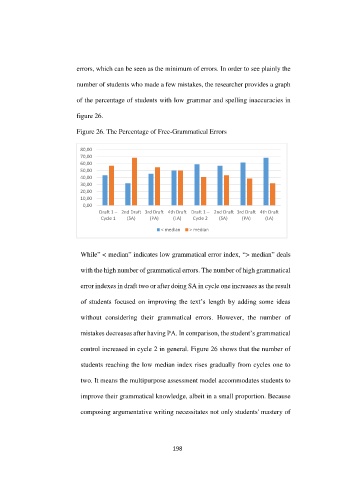
figure 26.
Figure 26. The Percentage of Free-Grammatical Errors
80,00
70,00
60,00
50,00
40,00
30,00
20,00
10,00
0,00
Draft 1 – 2nd Draft 3rd Draft 4th Draft Draft 1 – 2nd Draft 3rd Draft 4th Draft
Cycle 1 (SA) (PA) (LA) Cycle 2 (SA) (PA) (LA)
< median > median
While” < median” indicates low grammatical error index, “> median” deals
with the high number of grammatical errors. The number of high grammatical
error indexes in draft two or after doing SA in cycle one increases as the result
of students focused on improving the text’s length by adding some ideas
without considering their grammatical errors. However, the number of
mistakes decreases after having PA. In comparison, the student’s grammatical
control increased in cycle 2 in general. Figure 26 shows that the number of
students reaching the low median index rises gradually from cycles one to
two. It means the multipurpose assessment model accommodates students to
improve their grammatical knowledge, albeit in a small proportion. Because
composing argumentative writing necessitates not only students' mastery of
198