
Page 202 - BUKU SYNOPSIS
P. 202
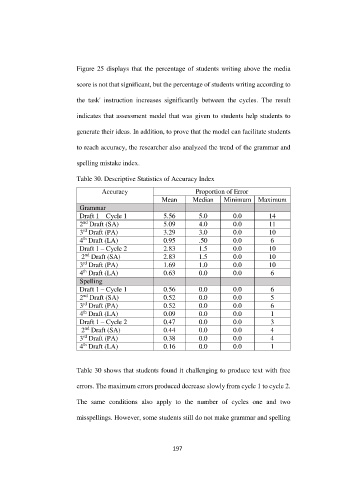
Figure 25 displays that the percentage of students writing above the media


                            score is not that significant, but the percentage of students writing according to

                            the  task'  instruction  increases  significantly  between  the  cycles.  The  result

                            indicates that assessment model that was given to students help students to


                            generate their ideas. In addition, to prove that the model can facilitate students


                            to reach accuracy, the researcher also analyzed the trend of the grammar and

                            spelling mistake index.

                            Table 30. Descriptive Statistics of Accuracy Index

                                     Accuracy                         Proportion of Error
                                                          Mean       Median     Minimum  Maximum
                             Grammar
                             Draft 1 – Cycle 1            5.56         5.0         0.0         14
                              nd
                             2  Draft (SA)                5.09         4.0         0.0         11
                              rd
                             3  Draft (PA)                3.29         3.0         0.0         10
                              th
                             4  Draft (LA)                0.95         .50         0.0          6
                             Draft 1 – Cycle 2            2.83         1.5         0.0         10
                               nd
                              2  Draft (SA)               2.83         1.5         0.0         10
                              rd
                             3  Draft (PA)                1.69         1.0         0.0         10
                              th
                             4  Draft (LA)                0.63         0.0         0.0          6
                             Spelling
                             Draft 1 – Cycle 1            0.56         0.0         0.0          6
                              nd
                             2  Draft (SA)                0.52         0.0         0.0          5
                              rd
                             3  Draft (PA)                0.52         0.0         0.0          6
                              th
                             4  Draft (LA)                0.09         0.0         0.0          1
                             Draft 1 – Cycle 2            0.47         0.0         0.0          3
                               nd
                              2  Draft (SA)               0.44         0.0         0.0          4
                              rd
                             3  Draft (PA)                0.38         0.0         0.0          4
                              th
                             4  Draft (LA)                0.16         0.0         0.0          1


                            Table 30 shows that students found it challenging to produce text with free


                            errors. The maximum errors produced decrease slowly from cycle 1 to cycle 2.

                            The  same  conditions  also  apply  to  the  number  of  cycles  one  and  two


                            misspellings. However, some students still do not make grammar and spelling


                                                              197