
Page 207 - Feline diagnostic imaging
P. 207
210 13 Acquired Heart Disease
(a)
(b)
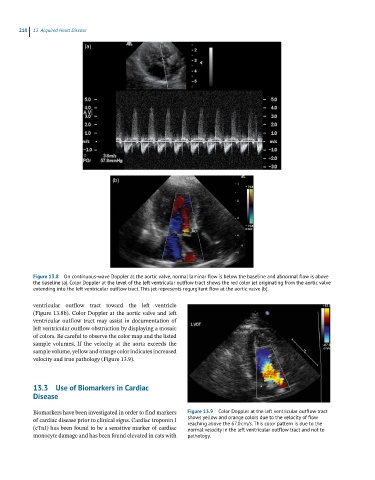
Figure 13.8 On continuous-wave Doppler at the aortic valve, normal laminar flow is below the baseline and abnormal flow is above
the baseline (a). Color Doppler at the level of the left ventricular outflow tract shows the red color jet originating from the aortic valve
extending into the left ventricular outflow tract. This jet represents regurgitant flow at the aortic valve (b).
ventricular outflow tract toward the left ventricle
(Figure 13.8b). Color Doppler at the aortic valve and left
ventricular outflow tract may assist in documentation of
left ventricular outflow obstruction by displaying a mosaic
of colors. Be careful to observe the color map and the listed
sample volumes. If the velocity at the aorta exceeds the
sample volume, yellow and orange color indicates increased
velocity and true pathology (Figure 13.9).
13.3 Use of Biomarkers in Cardiac
Disease
Biomarkers have been investigated in order to find markers Figure 13.9 Color Doppler at the left ventricular outflow tract
of cardiac disease prior to clinical signs. Cardiac troponin I shows yellow and orange colors due to the velocity of flow
reaching above the 67.0 cm/s. This color pattern is due to the
(cTnI) has been found to be a sensitive marker of cardiac normal velocity in the left ventricular outflow tract and not to
monocyte damage and has been found elevated in cats with pathology.