
Page 30 - PowerPoint Presentation
P. 30
LOS 34.l: Explain how a bond’s exposure to each of the READING 34: THE TERM STRUCTURE AND
factors driving the yield curve can be measured and how these INTEREST RATE DYNAMICS
exposures can be used to manage yield curve risks.
MODULE 34.6: INTEREST RATE MODELS
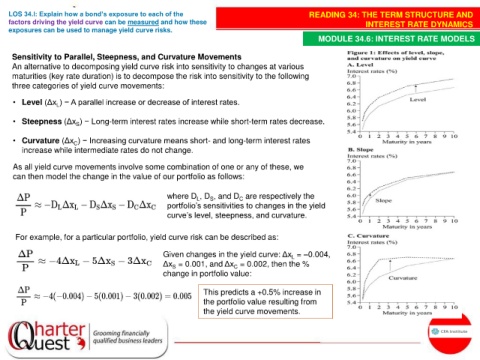
Sensitivity to Parallel, Steepness, and Curvature Movements
An alternative to decomposing yield curve risk into sensitivity to changes at various
maturities (key rate duration) is to decompose the risk into sensitivity to the following
three categories of yield curve movements:
• Level (Δx ) − A parallel increase or decrease of interest rates.
L
• Steepness (Δx ) − Long-term interest rates increase while short-term rates decrease.
S
• Curvature (Δx ) − Increasing curvature means short- and long-term interest rates
C
increase while intermediate rates do not change.
As all yield curve movements involve some combination of one or any of these, we
can then model the change in the value of our portfolio as follows:
where D , D , and D are respectively the
L
C
S
portfolio’s sensitivities to changes in the yield
curve’s level, steepness, and curvature.
For example, for a particular portfolio, yield curve risk can be described as:
Given changes in the yield curve: Δx = –0.004,
L
Δx = 0.001, and Δx = 0.002, then the %
C
S
change in portfolio value:
This predicts a +0.5% increase in
the portfolio value resulting from
the yield curve movements.