
Page 172 - AR DPBM-2016--SMALL
P. 172
Ikhtisar Utama Laporan Manajemen Profil Dana Pensiun Bank Mandiri
Key Financial Highlights Management Report Dana Pensiun Bank Mandiri Profile
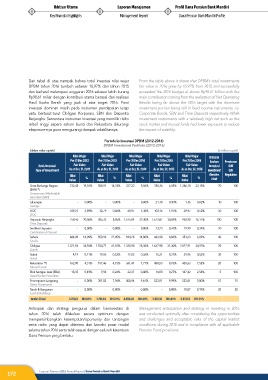
Dari tabel di atas nampak bahwa total investasi nilai wajar From the table above it shows that DPBM’s total investments
DPBM tahun 2016 tumbuh sebesar 10,97% dari tahun 2015 fair value in 2016 grew by 10.97% from 2015 and successfully
dan berhasil melampaui anggaran 2016 sebesar lebih kurang exceeded the 2016 budget at above Rp98.61 billion with the
Rp98,61 miliar dengan kontribusi utama berasal dari realisasi main contribution coming from the realization of Net Operating
Hasil Usaha Bersih yang jauh di atas target 2016. Porsi Results being far above the 2016 target with the dominant
investasi dominan masih pada instrumen pendapatan tetap investment portion being still in fixed income instruments, i.e.
yaitu berturut-turut Obligasi Korporasi, SBN dan Deposito Corporate Bonds, SBN and Time Deposits respectively. While
Berjangka. Sementara instrumen investasi yang memiliki risiko investment instruments with a relatively high risk such as the
relatif tinggi seperti saham bursa dan Reksadana dikurangi stock market and mutual funds had lower exposure to reduce
eksposure-nya guna mengurangi dampak volatilitasnya. the impact of volatility.
Portofolio Investasi DPBM (2012-2016)
DPBM Investment Portfolio (2012-2016)
(dalam miliar rupiah) (in billion rupiah)
Nilai Wajar Nilai Wajar Nilai Wajar Nilai Wajar Nilai Wajar Batasan
Per 31 Des 2012 Per 31 Des 2013 Per 31 Des 2014 Per 31 Des 2015 Per 31 Des 2016 Arahan Peraturan
Jenis Investasi Fair Value Fair Value Fair Value Fair Value Fair Value Investasi OJK
Type of Investment As at Dec 31, 2012 As at Dec 31, 2013 As at Dec 31, 2014 As at Dec 31, 2015 As at Dec 31, 2016 Investment OJK
Nilai Nilai Nilai Nilai Nilai Directive Regulation
Value % Value % Value % Value % Value % Limit
Surat Berharga Negara 722,45 19,10% 558,91 14,74% 237,23 5,06% 358,36 6,85% 1.286,10 22,15% 70 100
(SBN) *)
Government Marketable
Securities (SBN)
Tabungan - 0,00% - 0,00% - 0,00% 21,18 0,40% 1,36 0,02% 10 100
Savings
DOC 109,21 2,89% 32,79 0,86% 60,97 1,30% 103,16 1,97% 29,97 0,52% 50 100
DOC
Deposito Berjangka 758,46 20,06% 305,33 8,05% 1.515,04 32,30% 1.613,87 30,84% 938,90 16,17% 100 100
Time Deposits
Sertfikat Deposito - 0,00% - 0,00% - 0,00% 23,23 0,44% 19,99 0,34% 20 100
Certificates of Deposit
Saham 684,09 18,09% 850,96 22,45% 694,28 14,80% 463,90 8,86% 353,63 6,09% 40 100
Stocks
Obligasi 1.321,96 34,96% 1.554,77 41,01% 1.330,90 28,38% 1.637,98 31,30% 2.027,91 34,92% 20 100
Bonds
Sukuk 4,19 0,11% 19,86 0,52% 17,02 0,36% 16,31 0,31% 29,96 0,52% 30 100
Sukuk
Reksadana **) 162,90 4,31% 157,46 4,15% 361,47 7,71% 458,53 8,76% 438,63 7,55% 20 100
Mutual Funds
Efek beragun Aset (EBA) 18,35 0,49% 9,94 0,26% 22,37 0,48% 14,00 0,27% 147,42 2,54% 5 100
Asset Backed Securities
Penempatan Langsung - 0,00% 301,03 7,94% 450,94 9,61% 522,81 9,99% 522,81 9,00% 15 15
Direct Placements
Tanah & Bangunan - 0,00% - 0,00% - 0,00% - 0,00% 10,87 0,19% 20 20
Land & Buildings
Jumlah | Total 3.781,61 100,00% 3.791,04 100,00% 4.690,22 100,00% 5.233,32 100,00% 5.807,53 100,00%
Antisipasi dan strategi pengurus dalam berinvestasi di Management anticipation and strategy in investing in 2016
tahun 2016 telah dilakukan secara optimum dengan was conducted optimally after considering the opportunities
mempertimbangkan kesempatan/oportunity dan tantangan and challenges and acceptable risks of the capital market
serta risiko yang dapat diterima dari kondisi pasar modal conditions during 2016 and in compliance with all applicable
selama tahun 2016 serta telah sesuai dengan seluruh ketentuan Pension Fund provisions.
Dana Pensiun yang berlaku.
172 Laporan Tahunan 2016 Annual Report | Dana Pensiun Bank Mandiri