
Page 412 - Maxwell House
P. 412
392 Chapter 8
3. The second one is asymmetrical, and customary called the odd-mode excitation. Each trace
is connected to the source 0.25V with impedance or a single source of 0.5V with
impedance 2 connecting traces in series as Figure 8.2.2c depicts. If so, the characteristic
impedance of this combined line should be close to the impedance of slotline with
±
ground screen (look back in Chapter 6 at Figure 6.6.18). The vectors in Figure 8.2.2b show
roughly E- (solid red) and H-field (dotted magenta) vector orientation in such line. Since
±
in slotline the dominant mode is not purely TEM, its propagation constant ≅ ++
(however, not completely equal) is frequency dependable and defined by the mode field
structure.
4. From the above discussion follows that the two decoupled equivalent step line circuits
demonstrated in Figure 8.2.2d represent the coupler. We analyzed similar feed line
connection in Section 6.7.2 of Chapter 6 (check Figure 6.7.2) and Section 8.1.2 of this
chapter. If so, we can build the phasor bounce diagram similar to the shown in Figure 8.1.1c
for each circuit and then combine the magnitude and phase of all EM waves coming to the
ports.
The primary results of described even- and odd-mode analysis are:
1. All ports of directional coupler are perfectly matched at any frequency, i.e. the return loss
2 ++ ± ± ++ . Remind that, in
(RL) is zero (in relative units), while = ⋅ and = =
general, all these values are frequency dependent. Therefore, such equities could be
satisfied strictly speaking at a single frequency only. Nevertheless, the frequency variations
are typically very small and the multi-octave directional couplers keeping RL ≥ 20 dB or
higher are not unique. The classical frequency independent curves of the impedances for
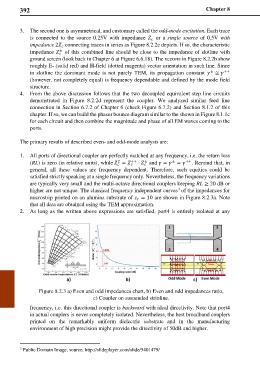
3
microstrip printed on an alumina substrate of = 10 are shown in Figure 8.2.3a. Note
that all data are obtained using the TEM approximation.
2. As long as the written above expressions are satisfied, port4 is entirely isolated at any
Figure 8.2.3 a) Even and odd impedances chart, b) Even and odd impedances ratio,
c) Coupler on suspended stripline.
frequency, i.e. this directional coupler is backward with ideal directivity. Note that port4
in actual couplers is never completely isolated. Nevertheless, the best broadband couplers
printed on the remarkably uniform dielectric substrate and in the manufacturing
environment of high precision might provide the directivity of 50dB and higher.
3 Public Domain Image, source: http://slideplayer.com/slide/5401479/