
Page 14 - FINAL CFA II SLIDES JUNE 2019 DAY 10
P. 14
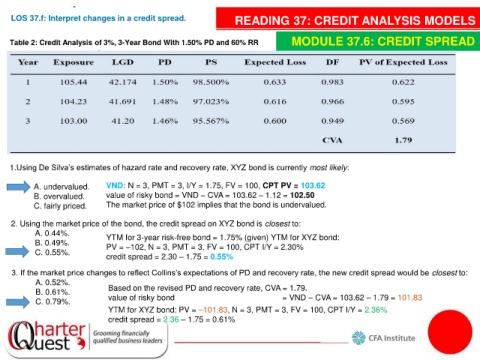
LOS 37.f: Interpret changes in a credit spread.                    READING 37: CREDIT ANALYSIS MODELS


    Table 2: Credit Analysis of 3%, 3-Year Bond With 1.50% PD and 60% RR                MODULE 37.6: CREDIT SPREAD


    1.Using De Silva’s estimates of hazard rate and recovery rate, XYZ bond is currently most likely:


           A. undervalued.       VND: N = 3, PMT = 3, I/Y = 1.75, FV = 100, CPT PV = 103.62
           B. overvalued.        value of risky bond = VND – CVA = 103.62 – 1.12 = 102.50
           C. fairly priced.     The market price of $102 implies that the bond is undervalued.

    2. Using the market price of the bond, the credit spread on XYZ bond is closest to:
           A. 0.44%.             YTM for 3-year risk-free bond = 1.75% (given) YTM for XYZ bond:
           B. 0.49%.             PV = –102, N = 3, PMT = 3, FV = 100, CPT I/Y = 2.30%
           C. 0.55%.
                                 credit spread = 2.30 – 1.75 = 0.55%

    3. If the market price changes to reflect Collins’s expectations of PD and recovery rate, the new credit spread would be closest to:
            A. 0.52%.
            B. 0.61%.            Based on the revised PD and recovery rate, CVA = 1.79.
            C. 0.79%.            value of risky bond                                                = VND – CVA = 103.62 – 1.79 = 101.83
                                 YTM for XYZ bond: PV = –101.83, N = 3, PMT = 3, FV = 100, CPT I/Y = 2.36%
                                 credit spread = 2.36 – 1.75 = 0.61%