
Page 11 - Naskah Publikasi Inggris ETD
P. 11
11
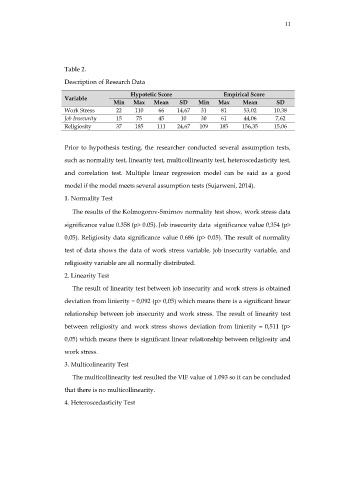
Table 2.
Description of Research Data
Hypotetic Score Empirical Score
Variable
Min Max Mean SD Min Max Mean SD
Work Stress 22 110 66 14,67 31 81 53,02 10,38
Job Insecurity 15 75 45 10 30 61 44,06 7,62
Religiosity 37 185 111 24,67 109 185 156,35 15,06
Prior to hypothesis testing, the researcher conducted several assumption tests,
such as normality test, linearity test, multicollinearity test, heteroscedasticity test,
and correlation test. Multiple linear regression model can be said as a good
model if the model meets several assumption tests (Sujarweni, 2014).
1. Normality Test
The results of the Kolmogorov-Smirnov normality test show, work stress data
significance value 0.358 (p> 0.05). Job insecurity data significance value 0,354 (p>
0,05). Religiosity data significance value 0.686 (p> 0.05). The result of normality
test of data shows the data of work stress variable, job insecurity variable, and
religiosity variable are all normally distributed.
2. Linearity Test
The result of linearity test between job insecurity and work stress is obtained
deviation from linierity = 0,092 (p> 0,05) which means there is a significant linear
relationship between job insecurity and work stress. The result of linearity test
between religiosity and work stress shows deviation from linierity = 0,511 (p>
0,05) which means there is significant linear relationship between religiosity and
work stress.
3. Multicolinearity Test
The multicollinearity test resulted the VIF value of 1.093 so it can be concluded
that there is no multicollinearity.
4. Heteroscedasticity Test